Applying Extinction Limited Ritzian Relativity
to Current Astrophysical Problems
Robert S. Fritzius
305 Hillside Drive, Starkville, MS
Presented as a Poster at the
NAS Arthur M. Sackler Colloquium
Challenges to the Standard Paradigm:
Fundamental Physics and Cosmology
November 1-3, 2002
Corrections added 26 July 2004 and 31 Oct 2011.
Changes are in bold.
This presentation is based on the presumption that the constancy of the "measured" speed of light by all observers (in vacuo) is an unresolved issue and that electrical charge may be an environmentally determined variable.
In 1908 Walter Ritz, formulated his preliminary emission theory of general electrodynamics(1) in which the velocity of a source is vectorially additive with the velocity of the light emitted by it, i.e., the velocity of light is c + v.
More important than Ritz's particular model of electrodynamics, (which had its problems) is that in the first half of his lengthy paper, Ritz thoroughly critiqued Maxwell-Lorentz electromagnetic theory, and concluded "The [Maxwell-Lorentz] partial differential equations and the notion of [the solid] ether are essentially inappropriate to express the comprehensive laws for the propagation of electrodynamic actions." (Ref 1, p. 172.)
Albert Einstein(2) says he based the kinematics of his special theory of relativity on Maxwell-Lorentz electromagnetic theory.
One of the problems with Ritz's theory is that its c+v aspect does not hold for light transmission over macroscopic length paths in the earth's atmosphere.
In 1913 Willem de Sitter(3) urged abandonment of Ritz's theory for outer space too, because visual binary stars failed to show predicted c + v effects. De Sitter's argument was along the following lines.
The addition of the velocity of a visible component of a binary star to
the velocity of its light emitted in the direction of an observer would allow slower
light (c - v) from one side of the orbit to be overtaken by the faster light
(c + v) from one half orbit later. At a certain distance this effect could cause the
visible component to periodically be seen at two different locations
simultaneously and generally would lead to apparent observational departures
from Keplerian motion.
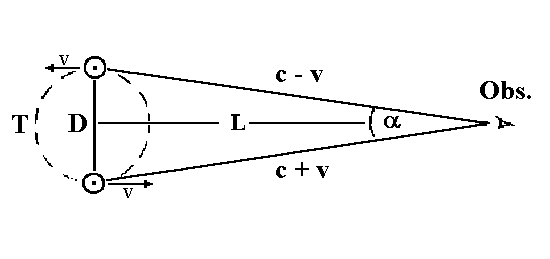
de Sitter's expression to compute the overtaking distance, is derived here.
Set the time interval t1 required for the slower light (visible component receding from observer) to reach the observer at distance L, to be:
and time interval t2 which is the sum of the time for one half orbit T plus the time for the faster light (component approaching observer) to travel the same distance L:
For t1 = t2 we have:
Re-arranging and solving for L we get:
In 1967 John Fox(4) claimed that visible binary stars do not offer evidence against the Ritz theory. He took that stand on the basis of Tolman's 1910 extinction theorem(5). According to Tolman, the absorption and re-radiation of electromagnetic radiation by electrical charges in a dispersive medium leads to a terminal speed for light with respect to the medium.* The effect is supposed to be exponential and Fox estimated that one Tolman extinction length in the local interstellar medium, is on the order of one light year. (Actual extinction lengths, if they exist, need to be determined.)
*Fox attributed this action to Richard Tolman, but Tolman strictly dealt with an abrupt change (c to -c), during reflection from a mirror. Tolman and de Sitter seem to have thought that interstellar gas, as well as the Earth's atmosphere, had no effect on the speed of light. [This correction was added on 26 July 2004.]
In 1987 Vladimir Sekerin(6), showed that, when we consider the source-to-observer distances required for de Sitter's binary star aberrations to manifest themselves, the angular resolution, the "seeing" of our best Earthbound telescopes (as of 1987) were insufficient for us to resolve the individual binary components.
Sekerin did not address extinction effects but he claims that de Sitter's hypothetical c + v binary star scenario provides an alternate explanation for the magnitude and apparent radial velocity variations of periodic variable stars, which he says may actually be spectroscopic binaries.
According to Sekerin, since de Sitter's "doubled" stellar images can't be optically resolved (under the conditions stated above), the temporarily combined images should appear twice as bright as expected.
In the following text and figures L will represent the exact overtaking distance in de Sitter's derivation above and Lo will represent the observer's fraction of (or multiple of) the distance L from the binary (or multiple) system.
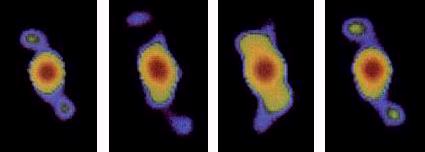
Sekerin's colleague, M.S. Serbulenko, kindly provided the author with three computer generated images, depicting brightness and apparent velocity curves, produced in accordance with Sekerin's binary star scenario. Figures 1,2 and 3 are scanned-in copies of Serbulenko's photographs. These plots are for a binary system with one visible component.
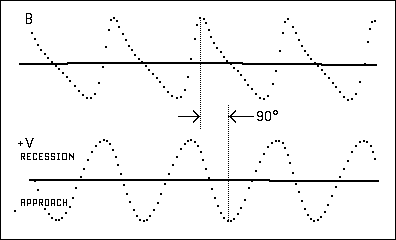
Figure 1. Brightness and Apparent Radial Velocity for Lo = 0.07 L.
This figure, according to Sekerin, could be for a Cepheid variable. However, for Cepheids, the peak (approaching) apparent radial velocity curve coincides with the peak of the brightness curve. Sekerin's radial velocity curve lags his brightness curve by 90 degrees.
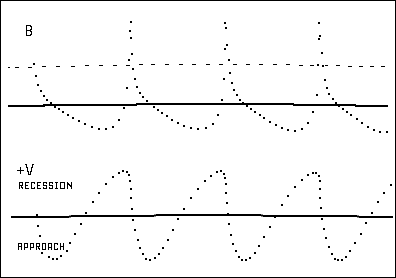
Figure 2. Brightness and Apparent Radial Velocity for Lo = 0.72 L
(de Sitter's argument is for Lo = 1.0 L.) With later light periodically overtaking earlier light, we get "Arrival-Time Modulation." These observed spikes, which could be interpreted as periodic eruptions, and would appear to be very energetic.
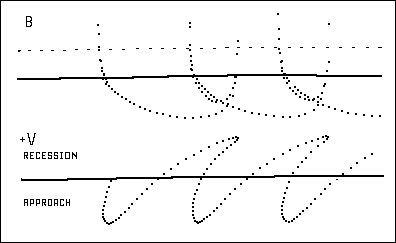
Figure 3. Brightness and Apparent Radial Velocity for Lo = 2.8 L
The arrival time reversals produce saddle shaped brightness curves that are similar to certain light-house model pulsars. Each CRT dot represents the . . . contribution of one segment of the orbit for the visible component.
The initial computer code written to simulate Sekerin's binary star scenario also produced 90 degree phase error between the magnitude and radial velocity curves. This phasing error, if not resolved, would invalidate Sekerin's thesis.
For a binary star in a c+v environment, remotely observed frequency variations can be caused by the same time modulation function that is hypothesized to cause the observed brightness variations. For close-in binary to observer separations, the time modulation produces what looks like Doppler effects.
The Doppler shifts, as a function of instantaneous orbit speeds was replaced by the following expression.
fo = fs / (d Tau / dt),
where fo represents the observed frequency, fs is the raw (unshifted) source frequency, and dTau/dt represents the differential of observed arrival-times versus real-time.
Since this temporal Ritzian aberration of observed frequency fo is
not a Doppler effect, it should be given a name which cannot be confused with ideas
associated with existing terminology. For now, the phrase time modulation
will be used.
For "local" binary-to-observer distances (less than 1.0 x 10exp-5 times the de Sitter overtaking distance L) the time modulation variations turn out to be equivalent to orbital Doppler effects. If the de Sitter overtaking distance happens to be 85 light years, then the 1.0 x 10exp-5 L fraction corresponds to approximately five astronomical units. At greater distances the time modulation effect begins to produce time-wise compressions of information when the component of concern is passing through its furthest point from the observer, and a stretching-out of information when the component is passing through the closest distance to the observer. These compressions and rarefactions produce frequency shifts that are more-or-less in-step with orbital accelerations with respect to the observer. Time-wise they precede typical Doppler effects by 90 degrees.
At about 3.0 x 10exp-5 times the overtaking distance (16 AU for L= 85 LY) the 90 degrees leading time modulation effect equals that of the Doppler-like effect. (A combination of the shifts leads to an overall 45 degrees leading phase shift as compared to Doppler alone.) Beyond 1.0 x 10exp-4 times the overtaking distance (54 AU for L= 85 LY) the time modulation acceleration-like effect dominates.
As the binary-to-observer distance reaches and exceeds the de Sitter overtaking distance, the intensity and time modulation curves come to display time-reversals with line doubling bounded by infinite-frequency excursions. (See figures 7 and 8 below.)
The linear relation between source-to-observer distance and the acceleration-like effects of the dTau/dt factor is reminiscent of Weber's 1846 electrodynamic expression for the forces that single electrical charges exert on each another as functions of their distances, accelerations and velocities with respect to one another. (Ritz proposed using something akin to Weber electrodynamics with a finite speed of transmitted effects.)
Figures 4 and 5 show a comparison of Doppler versus time-modulation induced apparent radial velocity effects. Note that the Doppler version has the same 90 degree phase error as produced by Serbulenko's computations as seen in Figure 1.
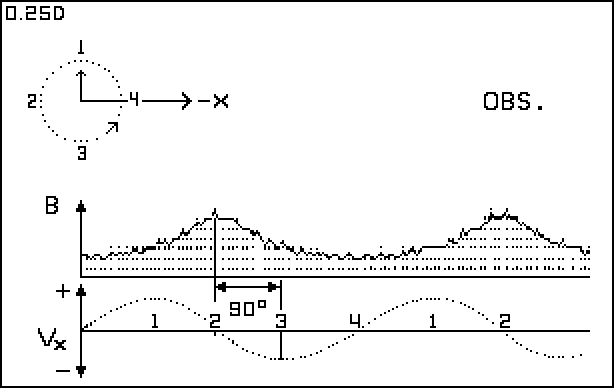
Figure 4. Lo = 0.25 L - Doppler
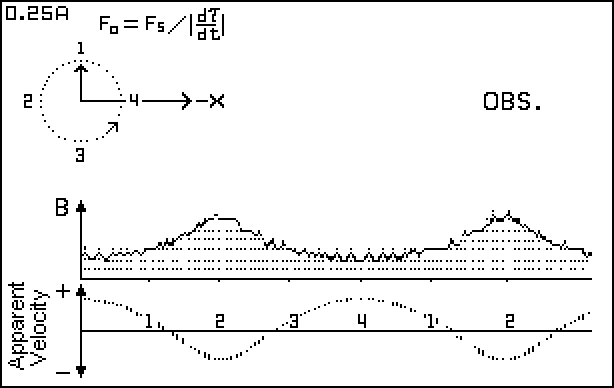
Figure 5. Lo = 0.25 L - Time Modulation
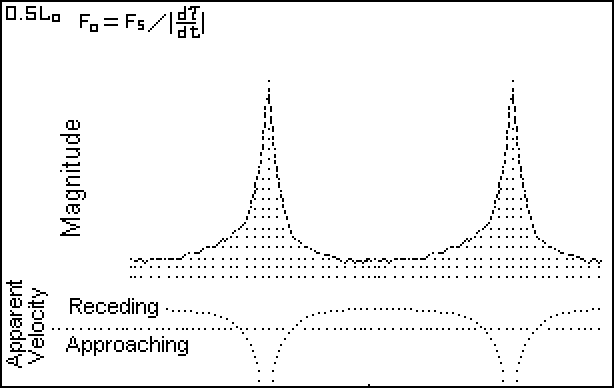
Figure 6. Lo = 0.5 L - Time Modulation
As stated above, the apparent velocity curves are based on the relation:
where Tau is the information arrival time. The absolute value of d Tau/dt is used because we have no easy way of telling whether the frequency of an observed spectral line is positive or negative. (During the time reversals, the apparent velocity comes out as a frequency-wise mirror image of itself.)
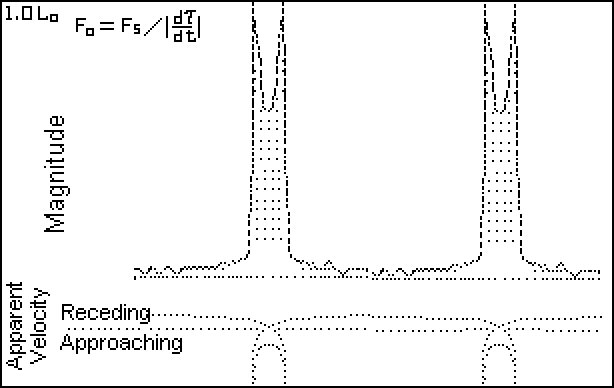
Figure 7. Lo = 1.0 L - Time Modulation
(There may be a glitch in the computer code. Intuition says that the splitting should not occur until the source-to-observer distance Lo becomes greater than L.)
When d Tau / dt approaches zero, the apparent radial velocity approaches infinity. The infinite peaks do not match any intrinsic stellar physical process. (Physical objects simply do not attain infinite speeds of expansion or contraction.) The velocity curve shows line-doubling in the saddle region which is caused by the radial velocity information looping back (time-wise) on itself.
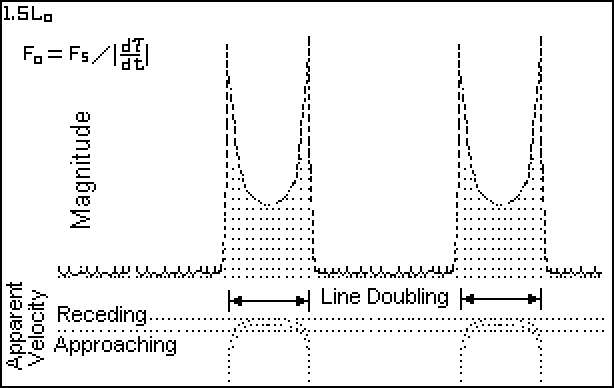
Figure 8. Lo = 1.5 L - Time Modulation
The light curve of Figure 8 bears a resemblance to that for the Geminga pulsar.
The following figure comes from the computer simulation for a binary star with both components visible. The component which produces the lower amplitude pulse has a semi-orbital diameter of 1.2 times that of the other component. Its lower amplitude orbital time modulation produces the broader, lower amplitude peak. The general shape of the light curve for this computed binary is similar to that for the optical light curve for the Crab pulsar.
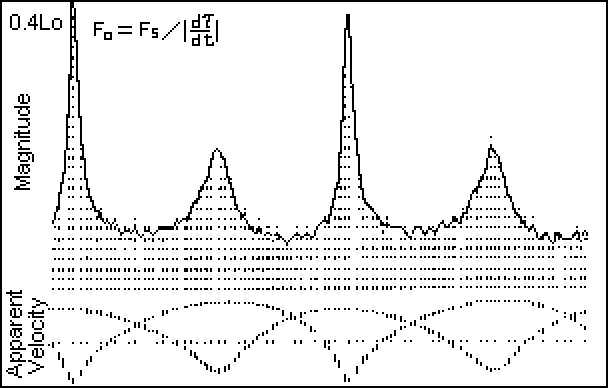
Figure 9. Lo = 0.4 L - Time Modulation
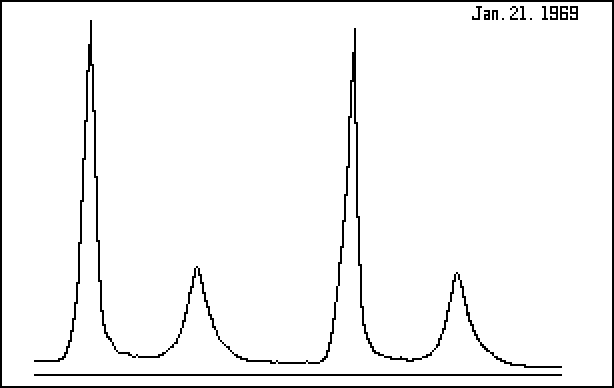
Figure 10. Crab Pulsar - NP 0532
After R. Lynds, Jan 21, 1969
Figure 10 shows an optical light curve for the Crab Pulsar. These pulses may be due to synchrotron radiation produced by a spinning neutron star combined with the lighthouse effect. If so, both peaks should show evidence of a common spectral origin. If the individual pulse spectra suggest two different sources then high speed - high resolution spectroscopy will be needed to provide us additional clues about the nature of this object.
It is proposed that the Crab pulsar is comprised of a pair of neutron stars, traveling in approximately circular orbits of radius 110 kilometers, would have orbital speeds on the order of 0.07 c and orbital frequencies of about 30 orbits per second. [Revised 30 Oct 2011.]
The above information was originally given as orbit radius = 200 km (17 "Houstons" based on the idea that a neutron star was "one Houston" in diameter; and the orbital speed = 0.014 c.
The shape of the light curve(s) for the Crab pulsar suggests an extinction distance equal to one half the de Sitter overtaking distance L, as calculated using equation 4.
![]()
Here T would be equal to one half of the 35 msec orbital period or 17.5 msec. We get L=187,ooo km. Half of this is 93,000 km which is about one fourth of the average earth-moon distance.
Using T = 16.5 msec (33 msec/2), v= 0.07 c, gives L = 35,000 km. Half of that distance, 17,500 km, is about five percent of the earth-moon distance. [Added 31 Oct 2011.]
The article by Massaro, et. al., titled A two component model of the Crab pulsar emission based on the BeppoSAX pulse profiles(7) concludes "We have shown that the pulse shape change of [the] Crab Pulsar in the X and low-energy Gamma rays can be explained by means of a two component model. These two components must have substantially different energy spectra and phase distributions." The authors suggest that a second emission region in the neutron star's magnetosphere adds to the total energy of the X-ray and low-energy Gamma ray spectrum of the interpulse bridge and the secondary pulse. They do not address the possibility that a binary star might serve as an alternative two component model.
Up to now, we have been considering the distance from binary to observer in terms of a given multiple of L. This can be a bit mis-leading. It may be more proper to re-define this distance as from the binary to extinction, as discussed by John Fox. Beyond this distance the light traveling to the observer will be traveling at the speed of light with respect to the dispersive interstellar medium. If the restricted Ritzian c + v hypothesis becomes validated then variable stars will provide us a tool to measure interstellar extinction distances and hence give us information about the density of interstellar matter near the sources.
Is SS 443 a Ritzian Variable?
According to the Ritzian c+v hypothesis the features that have been identified as jets could be interpreted as de Sitter images of a binary component.
SS 443 has two sets of moving X-ray lines which are more-or-less 180 degrees out of phase with each other. The period of these lines is the same as that of the jets. If it turns out that the phasing of one of the X-ray lines is found to present maximum blueshifts at the same times as the jets are at maximum brightness, then we may have reason to suspect that SS 443 is a Ritzian system.
Stellar Gamma-Ray Flashes
The flash for a given star (at points remote from the interacting bodies) should be in a fan-shaped zone (That's not stated correctly. See note below.*), which is oriented perpendicular to the component's plane of motion, and on the opposite side from perihelion. The flashes are not intrinsic to either (or any) of the stars involved. (In the local vicinity of the interacting stars there will be nothing in the way of a flash or burst.).
*Energy from any given SGF is not concentrated (or re-directed) in an angular sense. SGFs result from time-wise concentrations of energy that would have reached a given point anyway, but over a longer period of time.
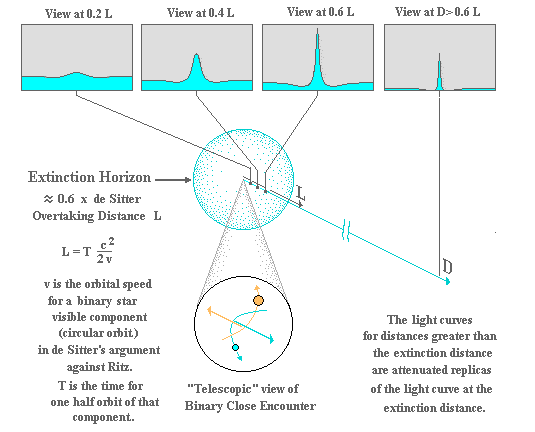
The (remote) arrival-time information-compressions that accompany perihelion passages can produce short duration spikes of extremely high energies where the Tolman extinction distance is on the order of 0.5 to 0.7 times the Ritz/de Sitter c+v overtaking distance. (The extinction phenomenon fixes or freezes the c+v effects for distances greater than that for extinction.)
The following graph shows a close encounter of two stars which could lead to gamma ray flashes. Light curves for the blue component are shown for increasing distances from the encounter. For this example a Tolman extinction distance equal to 0.6 times the de Sitter overtaking distance is used. (For simplification we will specify that extinction occurs at the stated distance.)
The spectral intensity peak of an otherwise conventional star or white dwarf can be chirped (a rapid upshift - followed by a rapid downshift) from the visible or ultraviolet regimes to the X-ray or Gamma-ray regimes, and back. This is intended to explain the paucity of optical counterparts for the majority of Gamma-ray flashes/bursts. Spectral analysis of Gamma-ray burst after-glows are predicted to reveal blueshifted conventional stellar absorption and emission lines which are sliding back downward toward their normal spectral habitats. (By the time these are captured most of the down-sliding will have already taken place.)
Thumbnail Energetics for Ritzian SGFs
Assume that the parabolic path of one of the interacting stars (in the diagram above) approximates the path for one fourth of a year for a planet which is traveling in a circular orbit. Then compress all of the star's radiant energy, for that one fourth year, into a flash of a 1 second duration. This particular time compression will lead to an intensity multiplication factor (during the 1 second flash) of 365/4 days * 24 hrs/day * 3600 secs/hr = 7.88 x 10exp+6. (#) The star would look almost eight million times brighter than normal for one second! For a 100 second pulse the intensity would drop to a mere 80,000 times brighter than normal. (#) [In the poster this was erroneously shown as 7.88 x 10 exp+8.]
Working with the 100-second scenario; if the star were to be radiating monochromatically in yellow light (say at 57.5 Angstroms), its compressed wavelength would come out to (57.5 x 10exp-10 meters) / (7.88 x 10exp+4) = 7.3 x 10exp-14 meters. The compressed wavelength corresponds to the high energy end for Gamma rays.
The Redshift Problem
In regions of space where the number density of material particles is low, there should be a deficit of force carrying particles as well. This condition could exist at the boundaries of our galactic disk. This leads to the prospect that the unit electrical charge in low-density regions will be lower than regions deep within the galactic disk.
If electrical charge is low in a region, we should expect to see intrinsically redshifted spectral phenomenon coming from that region. The further from middle of the galactic equator the redder the shifts.
The bottom line to this is that high redshifts may not necessarily correspond to distances of billions of light years. Local GRBs should not necessarily be ruled out on the basis of redshift data.
If decreased electric charge turns out to be a non-Doppler factor affecting the redshifts of GRB spectra, then we should see a Galactic latitude gradient in GRB redshifts. The greatest redshifts for GRBs will be found in directions approaching Galactic North and South, with no large-redshift GRBs seen in the Galactic plane.
The redshift ideas above go hand in hand with the author's 1993 Ritz-like model of stochastic electrodynamics(9) and his 1988 article on Cosmological Redshift(10) which was mainly concerned with quasars.
Evidence for Gamma-ray Eclipses?
Since binary star close encounters are hypothesized here, we should expect to occasionally see evidence of eclipses which block out portions of the burst/flash light curves. Some of these will occur in such a manner that a given burst will start, (creating the precursor) then be blanked by the eclipse, (the eclipsing star being of larger diameter than the burst source), followed by an extremely short rise-time to near peak activity (source pops back into view), followed by a normal peak and subsequent decay to the afterglow region. (Other eclipse effects, such as dips in the peaks should be expected too.) These kinds of things are in fact observed.
The following marked up BATSE graph(8) for GRB 910430 demonstrates hypothetical effects of a three body interaction. Here M1, the primary, has a radius on the order of 2 -10 times that of M2. The perihelion passage of M2 provides the main part of the burst. M3, a much smaller and less massive body than M2 is orbiting M2 in such a manner that its far side swings are not totally obscured (to the distant observer) during the eclipse of M2 by the larger M1. (The gravitational effect of M1 on M3 would be to repeatedly modify its orbit with respect to M2.)
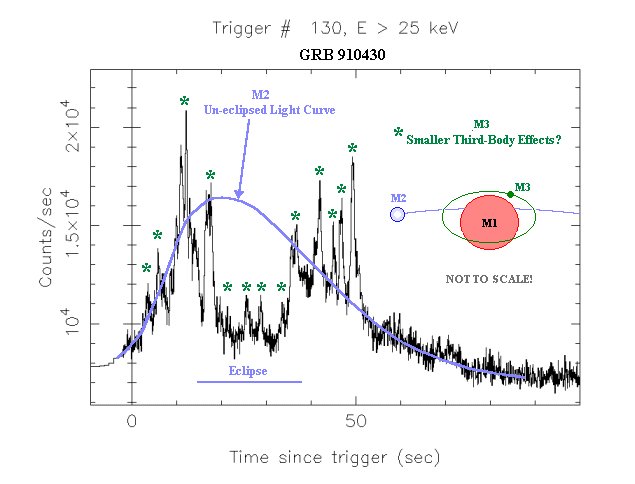
The abrupt cessation of the ancillary spikes (the suggested M3 effect) can be interpreted as M3 having being flung out of orbit from around M2, or crashing into either M1 or M2.
The article A Strange Supernova with a Gamma-Ray Burst indicates a possible link between a Gamma-ray burst and the supernova SN 1998bw. According to the Ritzian hypothesis, the GRB could be the tip of the iceberg, so to speak, of the supernova. Emission and/or absorption lines for the fading SN 1998bw supernova should be checked to see whether or not they are sliding downward in frequency toward an unperturbed stellar spectrum.
Revisiting a Special Relativity Test
Kenneth Brecher gave a paper on testing special relativity using Gamma Ray
bursts at the April 2000 APS meeting in Long Beach California. He evaluated
the expression c' = c + kv where k = 0 for special relativity and
k = 1 for the Ritz ballistic hypothesis. He states "If the SR second
postulate is invalid, photons emitted simultaneously towards an observer from a
source at distance L, characterized by internal velocities v (both
towards and away from the observer), will arrive at the observer as a pulse of
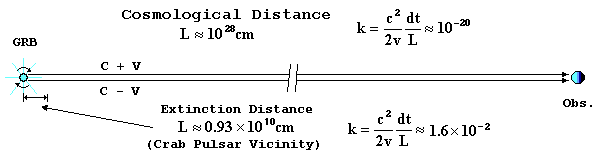
finite width dt, implying a value of k = (c^2/2v)(dt/L)." He used
v > 0.1c, dt = 1.0 msec and a cosmological
distance of 10^28 cm for L (GRB to observer). For these values we get
k = 10^-20. Brecher says "This represents, by a factor of 10^9, the most
precise test of the second postulate of special relativity to date."
Tolman's source-to-extinction distance has to be used in calculations, such as in Brecher's relativity test, rather than the source-to-observer distance, unless the latter is smaller of the two. (Extinction distances are generally very much shorter than cosmological distances.) When we plug in the extinction distance, as calculated for the Crab pulsar above, L=0.93*10^10cm, (which is approximately one fourth of the Earth-Moon distance) we arrive at a much fuzzier result for this SR test, i.e., k=1.6*10^-2.
The Ritzian time-compressions would also affect cosmic rays that happened to be headed our way from the binary sources. Since the cosmic rays should be traveling slightly slower than the speed of light, we should see cosmic ray bursts which lag their associated gamma ray bursts by times that are directly proportional to the distances from their sources to us.
Since, according to the Ritzian hypothesis, the non-intrinsic sources of gamma ray bursts can be in our own Milky Way neighborhood, we should expect to see cosmic ray bursts with no high energy cutoffs.
References
(1) W. Ritz, Ann. de Chim. et de Phys., 13, 145-275 (1908). An English translation of the Introduction and First Part of this work was privately published by the author in 1980. Portions of the translation are available on-line at http://www.shadetreephysics.com/crit/1908a.htm.
(2) A. Einstein, Sidelights on Relativity, G.B. Jeffery and Perrett, translators (Methuen & Co., London, p. 11 (1922).
(3) W. de Sitter, Phys. Zeits. 14, 429 (1913).
In German, In English
[Links added 16 May 2004.]
(4) J.G. Fox, Am. J. Phys. 33, 1 (1965).
(5) R. Tolman, Phys. Rev. 31, 26 (1910); ibid. 35, 136 (1912). [This latter ref was given as (1913)]
(6) V.I. Sekerin, Contemporary Science and Regularity in its Development, 4, 119-123, Tomsk University (1987). (In Russian.) A copy of this paper was furnished to the author via private correspondence. (An English translation is available on-line at http//www.shadetreephysics.com/sekerin.htm).
(7) E. Massaro, M. Litterio, G. Cusumano, and T. Mineo, Nucl. Phys. B - Proc. Supp., (1998) 69, 269-272.
(8) Compton Observatory BATSE Second Burst Catalog, Compact Disc, Disk 1, USA_NASA_COSSC_BATSE_0002.
(9) R.S. Fritzius, Emission-Absorption-Scattering Sub-quantum Physics, Presented as an invited paper at the 1993 International Conference on Sir Isaac Newton, March 22-27, 1993 at St. Petersburg, Russia. An on-line version is available at http://www.shadetreephysics.com/eas.htm.
(10) R.S. Fritzius, Cosmological Redshift, Technote 1-88, Magnolia Scientific Research Group, Starkville, Mississippi. (1988) An on-line version is available at http://www.shadetreephysics.com/cosmo_rs.htm.
Source code used to produce figures 4-9 is available at http://www.shadetreephysics.com/bas/d-cephei.bas
11 Nov 2002 - Mathematical expressions have been corrected to properly show powers of ten notation.