|
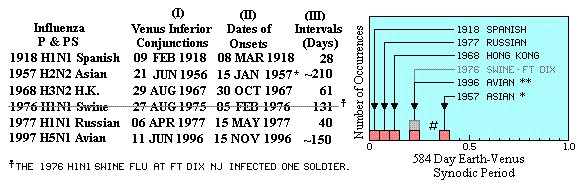
** As far as we know, the bird to human phase of the 1997 Hong Kong A(H5N1) avian
flu scare started in March 1997. Apparently the
same pathogen (H5N1) was
reported to have been causing fatal outbreaks in poultry flocks rural Hong Kong and in Guangdong
Province on the mainland that year. According to one source, 1.7 million
chickens died in Guangdong Province between November 1996 and April 1997. Thus, it appears that some point in November 1996 should
mark the actual onset of A(H5N1) activity in that region. The interval between the June
1996 Venus-Sun conjunction and that onset should be considered as being five months, or
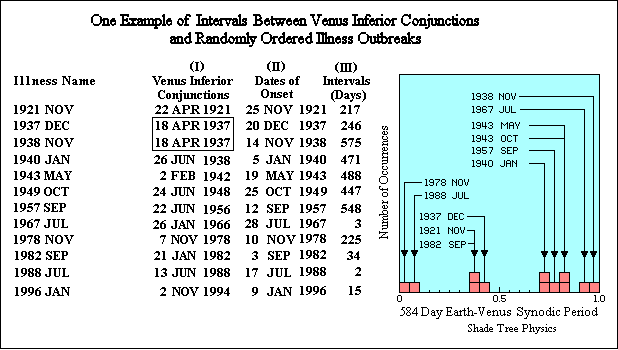
approximately 150 days. The data table and histogram, above, have been modified to show this
five month interval. (This paragraph was added on 8 April 2002 and updated on 9 April 2002.) Thus, it appears that some point in November 1996 should
mark the actual onset of A(H5N1) activity in that region. The interval between the June
1996 Venus-Sun conjunction and that onset should be considered as being five months, or
approximately 150 days. The data table and histogram, above, have been modified to show this
five month interval. (This paragraph was added on 8 April 2002 and updated on 9 April 2002.)
We now have indications that a new influenza virus, A(H1N2), was
identified in six cities in China in 1988-1989 but that the virus did not
spread further. . . . There was an inferior conjunction of Venus with the
Sun in June of 1988 which preceded the onset of that activity by about
six months. (This paragraph was added on 8 April 2002.)
To compare the onset dates of other disease outbreaks to the dates of Venus
inferior conjunctions with the Sun, see
Calculated Dates of Venus Inferior Conjunctions
with the Sun.
Since 2001, I've been compiling a list of the timing of other outbreaks
of new strains of influenza and influenza-like illnesses. At present the
list includes some Avian strains that were eventually shared by the
human population, Legionnaire's Disease, and SARS. I'm thinking about
adding some strains of equine encephalitis, and perhaps equine influenza.
On 17 August 2007, Australia experienced an outbreak of equine influenza
(of unknown origin). Humans are also susceptible to that influenza. is
The outbreak started on the same day as a Venus inferior conjunction
with the Sun.
Here is an updated copy of the list and histogram of the outbreak delays that
I've incorporated so far.
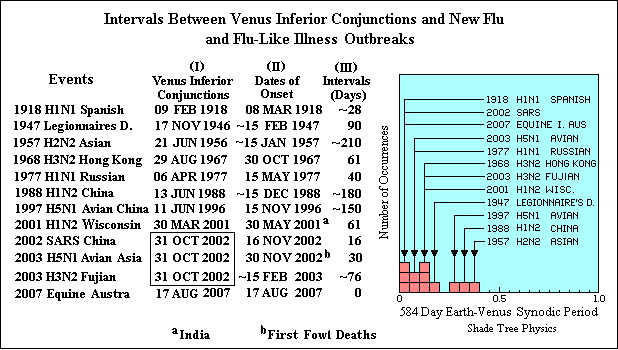
This list and histogram are copied from the page,
Venus Transit, Biohazard?"
The 17 Aug 2007 outbreak of Equine Influenza in Australia has been
incorporated.
A copy of this diagram was used in a poster
at the American Astronomical Society's
7-12 Oct 2007 meeting of the Division for Planetary Sciences meeting
in Orlando, FL.
An entry for the 1976 H1N1 "Swine Flu" entry, (which was shown in
the histogram as a grey box) has been removed. It represented
a pandemic scare. The scare was instrumental in
getting a nationwide influenza innoculation program going in the United
States, but it seems that the "affected population" was confined to one
soldier at Ft. Dix., NJ. [Updated 13 and 16 Nov 2007.]
Especially note that the 2002 SARS outbreak, the 2003 H5N1 Avian flu, and
the 2003 H3N2 Fujian flu all started shortly after the 31 October 2002
Venus inferior conjunction with the Sun. These events are enclosed
in a box shown on the list.
* * *
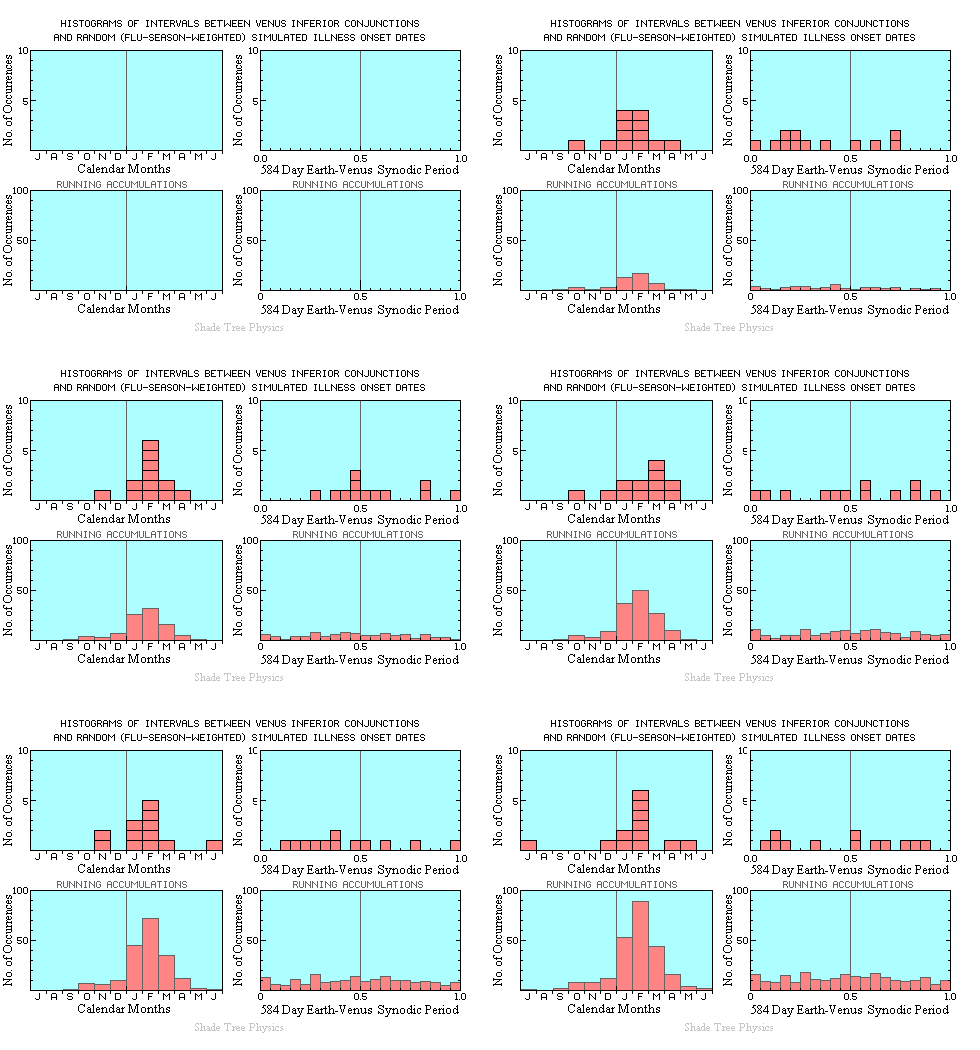
To show how unique the Inferior Conjunction to Illness Onset delay
distribution is, here is one example of what the data and histogram
would look like if the illness onset dates were strictly random.
[Added 10 Sep 2007.]
On 17 August 2007 Venus went through an inferior conjunction with the
Sun On that same day an outbreak (of unknown origin) of Equine
Influenza struck Australia. Humans are susceptible to the influenza as well.
(That outbreak has been added to the delays study list.) From
what I've read so far, Australia had no problems with Equine
Influenza prior to the August 17 outbreak. If it
turns out that no terrestrial precursors for this outbreak of equine
influenza are can be found, then the case for Venusian Flu will be
strengthed.
Here is a GIF Animation which shows two sequences of
histograms. The left side histograms, which start with
the month of July, show the calendar months in which simulated
illness onsets began. The right side histograms show the
delays between Venus Inferior Conjunctions and the illness onsets.
The lower frames show running accumulations of the upper histograms.
(The range of dates used here corresponds to the 20th century.)
A flu-season probability template was used in the creation of the
dates of each onset. There is quite likely a significant problem
with using a time-wise fixed template. Flu seasons peak in different
months, whereas the template is stationary with respect to a February
peak.
There are 20 frames in this sequence.
Note that, for the runs in this sequence, none of the
right side histograms ever show all twelve illness
events occurring in only one half of the 584 day synodic
period.
Random Flu-Season Related Events
[Added 10 Sep 2007. Expanded on 12 Sep 2007]
The QuickBASIC program used to generate the data for the histograms above
is rnd-fsd4.bas.
The data file generated, using the above program, is rnd-fs4.dat
Recommended articles and web pages.
"Sunspotting" influenza - moderndrugdiscovery - newsinbrief, July 2001.
References
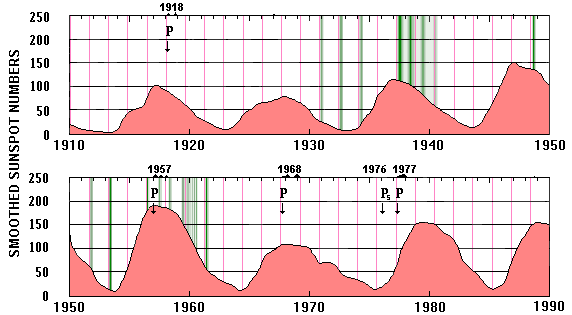
 The smoothed sunspot numbers are derived from
Annual Sunspot Numbers - published on the web by The Regents of the University of Michigan.
 Donald R. Barber, "Invasion by Washing Water," Perspective, 5, 201-208 (1963)
 Monessen and the Spanish Influenza of 1918
[Page no longer available.]
 Pandemics and Pandemic Scares in the 20th Century - CDC NVPO [Page no longer available.]
 Time, June 24, 1957, p. 80.
 Newsweek, January 8, 1968, p. 43. "Actually the [1968-1969]
bug struck a little ahead of schedule when some 3000 students at
Western Michigan University, Kalamazoo, came down with flu last October."
 Encyclopedia of Plague and Pestilence, Ed. George C. Kohn, Facts on
File, New York, NY., 1995,
p. 7.
 Vol. I, No.4 ~ EINet News Briefs ~ 11-01-98 - APEC Emerging Infections Network.
[Page no longer available.]
|
|
