|
Influenza Periodicity
Shade Tree Physics
Installed 20 May 2012 [as part of Venus Atmosphere Temperature
and Pressure Profiles]
Latest update 27 Sep 2018.
Text additions or modifications are in bold.
Quoting from Edwin D. Kilbourne (2006): “Three worldwide (pandemic) outbreaks of
influenza occurred in the 20th century: in 1918, 1957, and 1968. The latter 2 were
in the era of modern virology and most thoroughly characterized. All 3 have been informally identified by their presumed sites of origin as Spanish, Asian, and
Hong Kong influenza, respectively. They are now known to represent 3 different
antigenic subtypes of influenza A virus: H1N1, H2N2, and H3N2, respectively. Not classified as true pandemics are 3 notable epidemics: a pseudopandemic in 1947
with low death rates, an epidemic in 1977 that was a pandemic in children, and
an abortive epidemic of swine influenza in 1976 that was feared to have pandemic potential. Major influenza epidemics show no predictable periodicity or pattern,
and all differ from one another. Evidence suggests that true pandemics with
changes in hemagglutinin subtypes arise from genetic reassortment with animal
influenza A viruses.”(1)
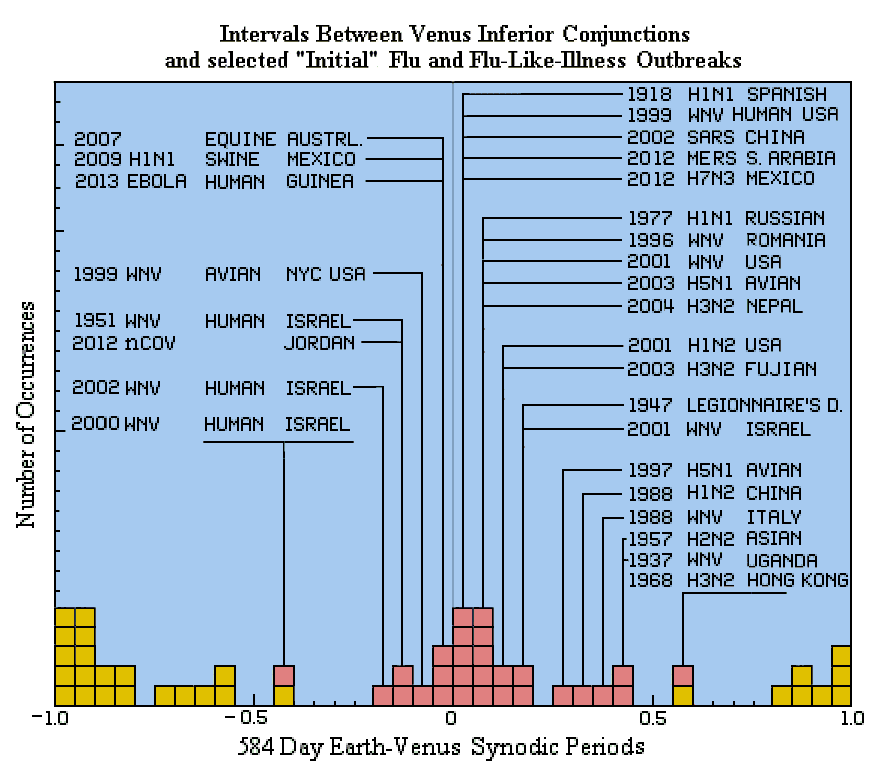
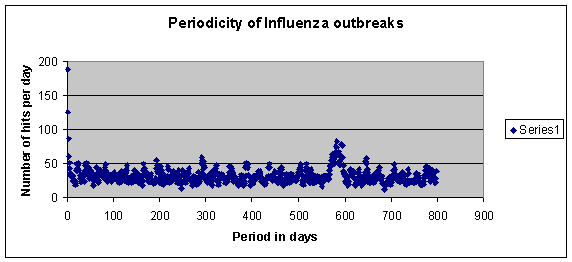
This study looks at the possibility of predictable periodicity of influenza and influenza-like epidemics, including West Nile Virus
(WNV)
in the United States, Severe Acute Respiratory Syndrome
(SARS),
Mideast Respiratory Syndrome Coronavirus
(
MERS-CoV) and the 2014
Ebola
outbreak in Western Africa.
I use some historical bacterial invasions as a stepping stone to the viral outbreaks.
In Worlds in Collision(2) Immanuel Velikovsky speculates about the
possibility of bacterial and insect life forms existing in the Venusian atmosphere
some 3500 years ago.
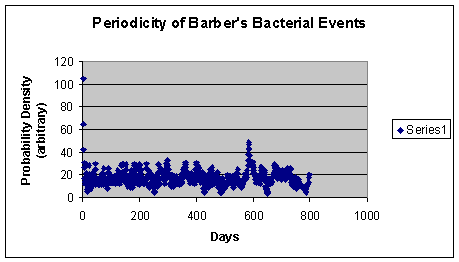
The following data table and graphs may show evidence of bacteria and viruses in
the Venusian atmosphere that have been being transported to earth periodically
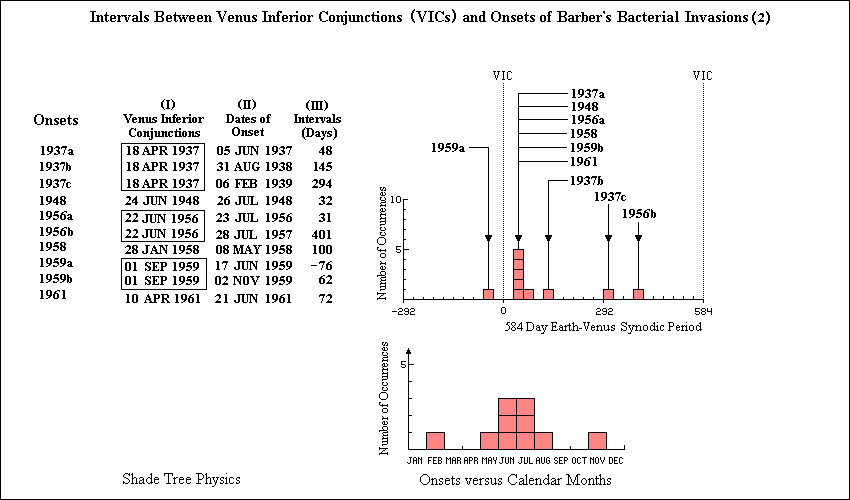
by the solar wind . The detailed data table, just below, is extracted from Donald Barber's
1963 article, "Invasion by Washing Water."(3) [Added 20 May 2012. Latest update
16 Sep 2014.]
                               INTERVALS BETWEEN GEOMAGNETIC STORMS AND BACTERIAL ACTIVITY
               ---------------------------------------------------------------------------------------
                                                                           Inf.      Nearest     Time
               Event   Date of          Degree of Bacterial Activity       Conj.   Geomagnetic    Lag
                        Onset                                              Date       Storm     (Days)
               ---------------------------------------------------------------------------------------
                  a  1937 Jun  5    Water-borne infection very severe                  1937
               1  b  1938 Aug 31     first phase, less severe in           1937        Apr        41
                  c  1939 Feb  6     recurrent outbreaks. Long            Apr 18      24-25*
                                     continued activity.                              26-27
               ---------------------------------------------------------------------------------------
               2     1948 Jul 26    Severe                                 1948        1948       66
                                                                          Jun 24     May 21-22
               ---------------------------------------------------------------------------------------
               3  a  1956 Jul 23    Water-borne infection preceded by      1956        1956       61
                  b  1957 Jul 28     airborne yeast like organisms.       Jun 22     May 23-25
                                     Very severe in initial stages.
               ---------------------------------------------------------------------------------------
               4     1958 May  8    Relatively slight and short lived.     1958        1958       57**
                                                                          Jan 28      Feb 11*
               ---------------------------------------------------------------------------------------
                  a  1959 Jun 17    Moderate and short lived.              1959        1959       35
               5                                                           Sep 1    May 11-12*
                  b  1959 Nov  2    Slight but long continued.                       Sep 3-4      59
               ---------------------------------------------------------------------------------------
               6     1961 Jun 21    Moderately severe; short lived.        1961        1961       67
                                                                          Apr 10     Apr 14-15
               ---------------------------------------------------------------------------------------
                  *Signifies "great" geomagnetic storm.    **value is actually 87
Barber used the above table to draw attention to the geomagnetic storms which happen
to occur near the times of Venus inferior conjunctions as a causal effect leading to bacterial transfers from Venus to earth. The following graph uses his data to focus
on the relation between the inferior conjunctions themselves and the timing of the observed semi-periodic bacterial invasions. [Added 31 Jul 2014.]
|
|


