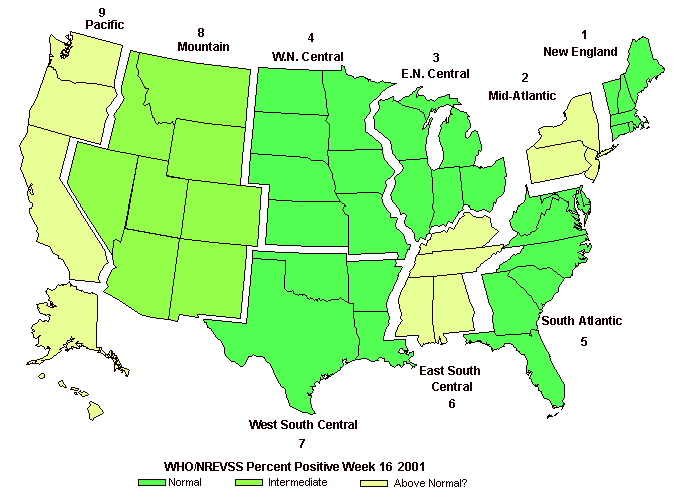
1st Quarter 2001 Influenza Data Analysis (USA)Installed Approximately 10 May 2001 - Latest Update - 25 Dec 2016 Additions or changes are in bold. The following Week 16 Map was prepared based on data published in the Week 18 2001 regional reports by the World Health Organization/National Respiratory and Enteric Virus Surveillance System WHO/NREVSS. |
|
The following Percent of Positive Influenza Isolates versus Region data,
for weeks 10-18 2001, were extracted from WHO/NREVSS regional reports published
in the CDC's Influenza Summary Update for week 18 2001. For week 16, three
regions have notably higher percentages than might be expected based on the
general behavior of the surrounding data.
|
| New England (NE) | West North Central (WNC) | West South Central (WSC) |
| Mid Atlantic (MA) | South Atlantic (SA) | Mountain (MTN) |
| East North Central (ENC) | East South Central (ESC) | Pacific (PAC) |
| Week | NE | MA | ENC | WNC | SA | ESC | WSC | MTN | PAC |
| 10 | 1.6 | 9.4 | 9.3 | 6.2 | 9.3 | 5.1 | 7.1 | 7.1 | 10.1 |
| 11 | 11.4 | 7 | 7.7 | 6.8 | 6.5 | 1 | 2.7 | 4.9 | 8.8 |
| 12 | 6.5 | 4.7 | 6.6 | 5.4 | 10.5 | 3.4 | 0.9 | 2.9 | 10.6 |
| 13 | 17.9 | 1.9 | 3.8 | 5.2 | 5.6 | 2 | 0.8 | 2.1 | 0.5 |
| 14 | 15.4 | 2.5 | 6.6 | 2.8 | 3.3 | 0 | 0 | 1 | 0.3 |
| 15 | 0 | 2.5 | 4.1 | 2.8 | 4.6 | 0 | 0 | 0.5 | 0.4 |
| 16 | 0 | 5.7* | 2.7 | 1.5 | 2 | 3.7* | 0 | 1.7 | 5.8* |
| 17 | 0 | 0 | 1.6 | 0 | 0 | 0 | 0 | 1.9 | 0 |
| 18 | 0 | No Data | No Data | 0 | 0 | 0 | 0 | 0 | 0 |
|
All influenza isolates identified for week 16 (totaling 28) were type B. These show up as a bump on the seasonal graph of influenza isolates in the CDC's weekly report for week 18. Please note that this detailed information is not archived with each weekly CDC report. The next graph shows how the influenza like illness (ILI) reports tapered off (by region) in the final weeks of the 2000-2001 influenza season.
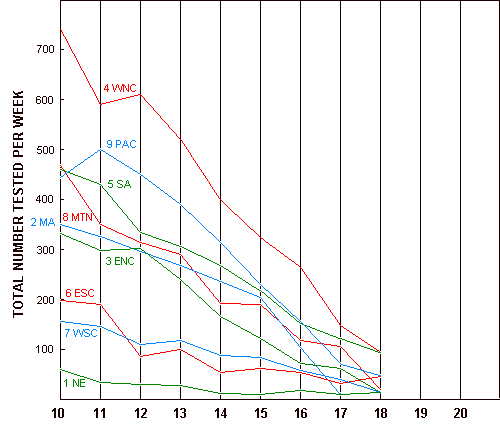
Total Number of Influenza Like Illnesses Tested by Week
Added 9 June 2001 - Revised 10 June 2001
|
| New England (NE) | West North Central (WNC) | West South Central (WSC) |
| Mid Atlantic (MA) | South Atlantic (SA) | Mountain (MTN) |
| East North Central (ENC) | East South Central (ESC) | Pacific (PAC) |
| Week | NE | MA | ENC | WNC | SA | ESC | WSC | MTN | PAC |
| 10 | 1.4- | 9.4 | 9.3 | 6.2 | 9.3 | 5.1 | 7.1 | 7.1 | 10.1 |
| 11 | 8.2- | 7 | 8+ | 6.8 | 6.5 | 1 | 2.7 | 4.9 | 8.8 |
| 12 | 4- | 4.7 | 6.9+ | 6.4+ | 10.4- | 3.4 | 0.9 | 2.9 | 10.6 |
| 13 | 11.1- | 1.9 | 4.5+ | 5.5+ | 5.6 | 2 | 0.8 | 2.1 | 9.5++ |
| 14 | 15.4 | 2.5 | 6.9+ | 3.2+ | 3.2- | 0 | 0 | 1 | 8.4++ |
| 15 | 0 | 2.4- | 4- | 3.6+ | 4.4- | 0 | 0 | 0.5 | 3.3++ |
| 16 | 0 | 5.8+* | 1.5- | 1.7+ | 1.6- | 3.7* | 0 | 1.4- | 3.2-- |
| 17 | 0 | 0 | 0.9- | 0 | 0 | 0 | 0 | 1.4- | 0 |
| 18 | 0 | 0 | 0.9 | 0 | 0 | 0 | 0 | 0 | 0.5+ |
| 19 | 6.7 | 0 | 0 | 0 | 0 | 0 | 2.6 | 0 | 0 |
| 20 | 20 | 10 | 0 | 0 | 0 | 0 | 0 | 0 | 0.9+ |
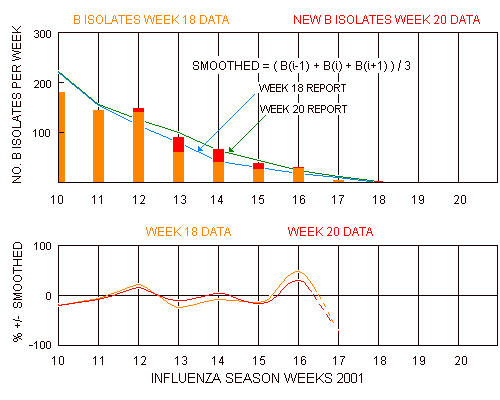
Below is a graph of the Influenza B isolates showing both week 18 and week 20 data. The blue and green lines behind the data bars represent smoothed isolate counts.
Just below this graph is a plot showing the weekly differences between the weekly isolate counts and the smoothed counts. These are expressed as percents of the smoothed counts.
For week 18 an intriguing increase in the total number of Influenza Like Illnesses tested appears in four (possibly five) of the nine reporting regions. These are the (2) Mid Atlantic, (3) East North Central, (6) East South Central, (7) West South Central (maybe), and (8) Mountain regions.
The following four graphs show total numbers of Influenza Like Illness specimens tested per week by WHO/NREVSS for each of the nine reporting regions in the United States. (Each regional graph has two branches. The lower branches represent data published in the week 18 reports. The upper branches reflect the data published in the week 20 reports.)
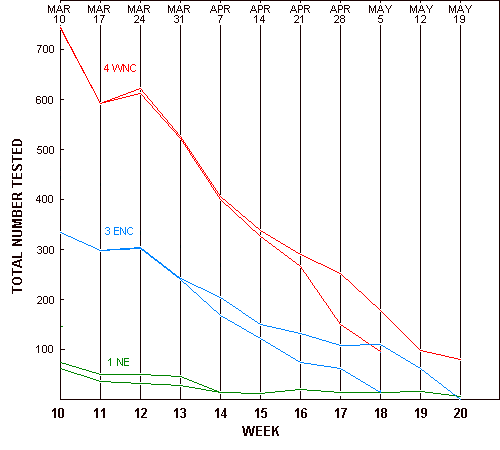
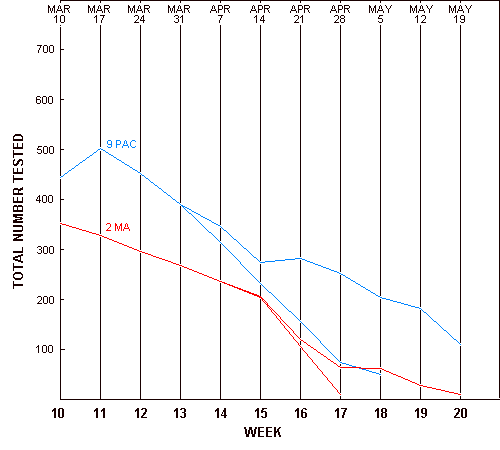
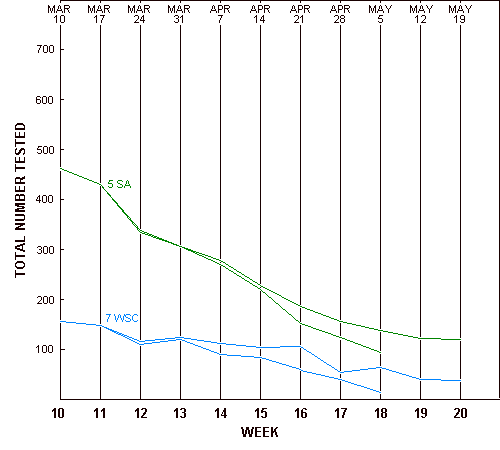
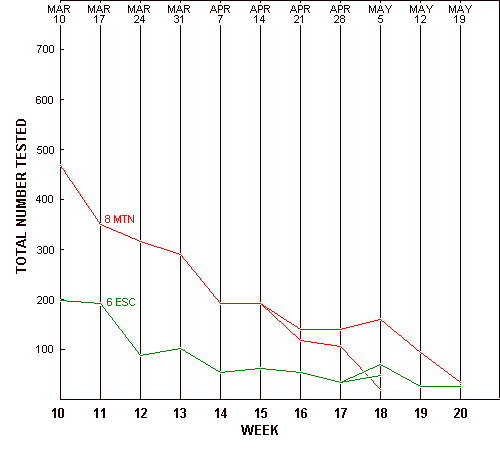
Week 18 (ending Friday May 5, 2001) encompasses the beginning of the 30 to 60 days hypothetical Flu-Watch period, following the 29 March 2001 Venus inferior conjunction. .
Amongst the week 18 Influenza Like Illnesses which did not turn out to be recognizable as A(H1N1), A(H3N2), A(Unknown), or B viruses there may be some visitors worth getting to know.