USA Influenza Activity, 2004-2005

Aprox One Year Ago | Peak 2004-2005 | Archive (Weekly)
Maps with changes circled - 10 Dec 11 Jan 15 Jan 08 Feb 12 Feb
For detailed info, see: http://www.fluwatch.com/index2.html [Link no longer works - Feb 2009.] (Macro Media™ version)
See CDC's Flu Activity and Surveillance and Canada's FluWatch - (English edition)

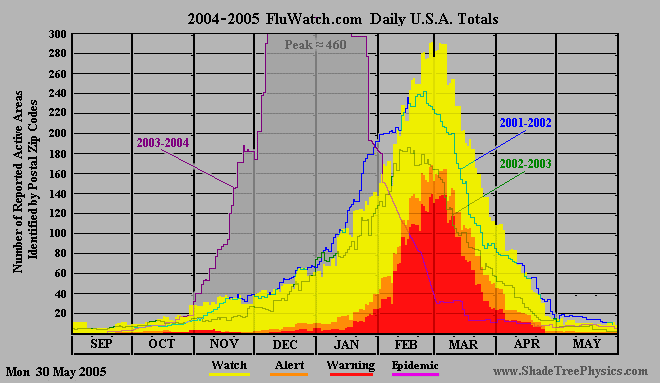
Above is a seasonal histogram of FluWatch.com daily activity levels for the USA. (The height of each daily column corresponds to the sum of the totals for all four activity levels for the day.) This season's activity levels may be compared to those for the 2001-2002, 2002-2003, and 2003-2004 flu seasons.
11 March 2005 - The spreadsheet (derived from FluWatch.com daily reports), which underlies the current information in the above graphs, may be seen at http://www.datasync.com../vel/fw0405.xls.
USA FluWatch.com Activity, Summers of 2002, 2003, and 2004
USA FluWatch.com Activity, September 2001 thru the end of 2004
14 Feb 2005 note (Revised 11 March 05): At the height of the season the NFSN™ staff on occasion published FluWatch.com activity increases and decreases on alternate days. This caused some daily variations appear to be about twice the amplitude of their actual values. Usually no variations were published on Sundays.
The ZymeTx, Inc.
ZstatFlu™ rapid influenza test, used by physicians of the National Flu Surveillance
Network (NFSN) in the production of daily FluWatch reports, responds to both Influenza A and
Influenza B. FluWatch.com uses the following levels of influenza activity in a given area.
Watch: Positive flu results have been reported.
Alert: Positive flu results are being reported as consistently as every other day in moderate
numbers.
Warning: Positive flu results are being reported consistently on a daily basis in high numbers.
Epidemic: Flu is widespread in the area.
12 December 2004
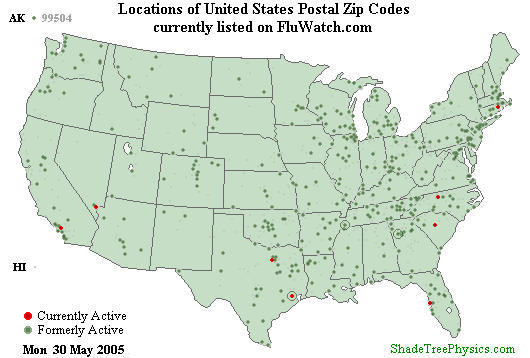
The author of this page did not intend to create the FluWatch map (as seen at the top of this page)
this season because of the time that would be involved. However, in light of the unique clustering of
influenza active areas in Massachusetts and southeastern New Hampshire, it was felt that the map
had become a necessity. Viewers should note that the early season active spots in coastal southern
California have currently winked out.
There are approximately 42,000 postal zip codes in the United States. During any given flu season, slightly more than 2000 NFSN physicians are tapped to forward the results of their rapid influenza tests to Oklahoma City. From these, the daily FluWatch.com reports are produced. (The doctors' office zip codes, rather than those of their patients, are used.) This means that at any given time, at minimum, about five percent of the US zip codes will have some NFSN sampling. NFSN doctors should typically have patients from an average of five different zip codes, so that 25 percent or more of the country should have some representation in the FluWatch.com reports. (These estimates are subject to change.) [Added 27 December 2004. Modified 28 Dec.]
Tuesday 11 January 2005
Today there was an unusually strong spike in new influenza activity reported
across the United States. (28 Zipcodes turned active.) Washington state was
hit particularly hard with a total of nine Zipcodes. Other than one Zipcode
in Los Angeles, CA, there were no other new activity levels within three
states in any direction from Washington. The Rocky Mountain states were not
touched by the activity spike. See the map for
11 Jan 2005.
(From the map, hit Back to return to this point.)
[Added 14 January 2005.]
Tuesday 8 March 2005
Thanks to the
Sandy Springs Regional Library of the Atlanta-Fulton
Public Library System, for the use of their high-speed internet connections
during the period 3-5 March 2005. It was at the peak of this U.S.
flu season (with the author on the road) and the daily data pulls from
FluWatch.com were averaging one and three-quarters hours to accomplish.
Search Words
County, Epidemiology, Flu data, Flu Maps, flu report, Influenza activity Histogram,Influenza cases by Zipcode, Influenza data, Influenza Maps, State, USA Flu Activity, Zipcode