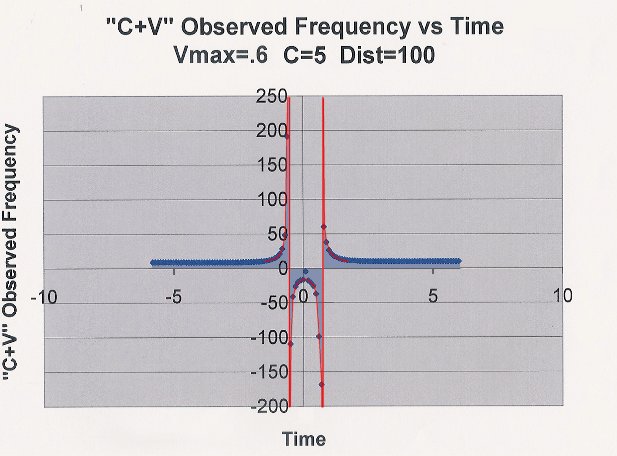
Notice the negative frequencies between the spikes.
The Excel spread sheet used to create this graphic is: ep65100a.xls.
Since spectrum analyzers don't normally tell us whether frequencies are positve or negative (as if such could exist), the following spectrum is more likely to be seen. (The negative frequency section has been flipped to the positive side of the baseline.)
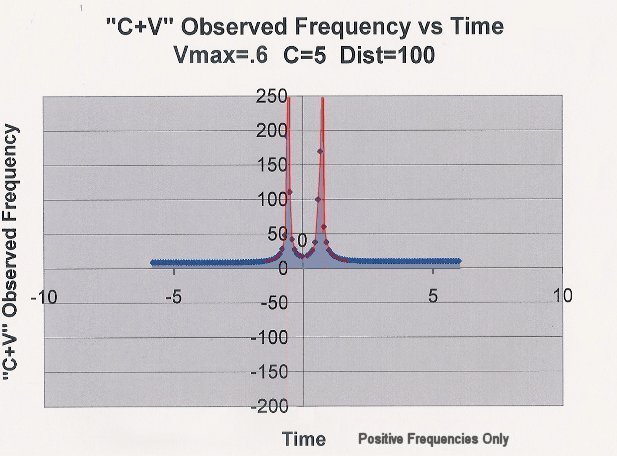
All Positive Frequencies
The absolute magnitude of the light curve for this binary system (as viewed from the specified distance) should be pretty much a replica of this frequency curve.